The Presidential debates are raging and election season is in full swing. According to some recent poll of polls, the race between Obama and Romney is a statistical dead heat. As exciting as that is, don't forget about your local issues. One of of the most important and long-lasting is Measure J. According to
Metro, Measure J will "extend an existing voter approved half-cent transportation sales tax, until 2069, in order to accelerate the construction of regional traffic relieving highway and transit projects. The measure will also provide 30 additional years of funding for local transportation improvements and operation of regional transit services."
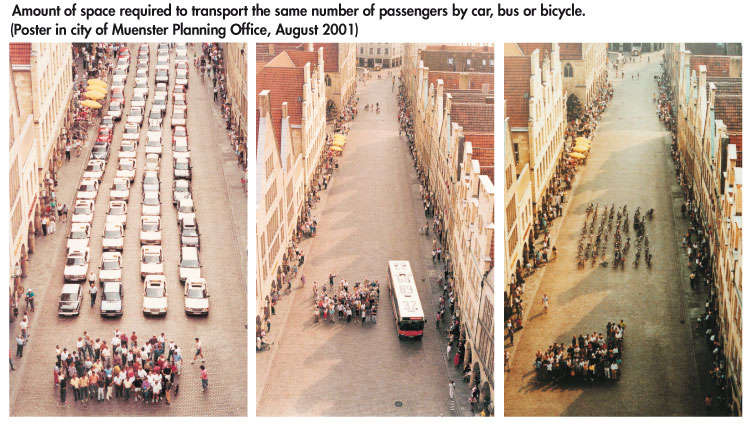
Please consider the graphic above as you consider voting for Measure J. You can read the LA Times endorsement
here, which said that "extending the tax increase approved by voters in 2008 would be a win for transit, the economy and the future of L.A. County." You can also read more about Measure J from
Metro below:
What is Measure J?
Measure J will extend for 30 additional years the existing one-half cent sales tax that was approved in 2008 (Measure R) and is currently set to expire in 2039. The additional funds will be used to sell bonds, which will allow Metro to accelerate construction of transportation improvements. According to a 2008 study by the private non-profit Los Angeles County Economic Development Corporation (LAEDC), the current tax costs residents an average of $25 per person per year. Because Measure J will extend the existing sales tax, it is anticipated the costs will remain the same, adjusted for inflation. Tourists and businesses also contribute money through the sales tax. The measure also allows transit and highway funding priorities to be shifted between projects within subregions of Los Angeles County, if approved by a two-thirds vote of the Metro Board.
Regional Impact
LAEDC reports that the projects accelerated through Measure J will advance the creation of 250,000 new local jobs (direct, indirect and induced workers). By starting construction on seven rail and rapid transit projects, and up to eight highway projects within the next five years, instead of the twenty years currently planned, this job creation will be accelerated. The measure will also provide an additional thirty years of continued funding for local transportation improvements (ex. pothole repair, signal synchronization, local roadway and bridge safety improvements), countywide bus and rail service operations, Metrolink and Metro Rail capital improvements, and administration. The LAEDC projects that these activities will generate another 220,000 direct, indirect and induced jobs in addition to the employment advanced by the transit and highway project acceleration noted above.
Taxpayer Oversight
Under the existing measure, there is an annual independent audit and report to taxpayers, and ongoing monitoring and review of spending by the independent taxpayer oversight committee. The reports are available for public review on the internet and in public libraries. This oversight will continue with Measure J.